interactive spatial region and feature range filtering of image and tabular data,
creating traceable histograms to persistent sources of very large image collections, and
computing statistics and estimating statistical models of image features.
The functionality of the tool is illustrated below.
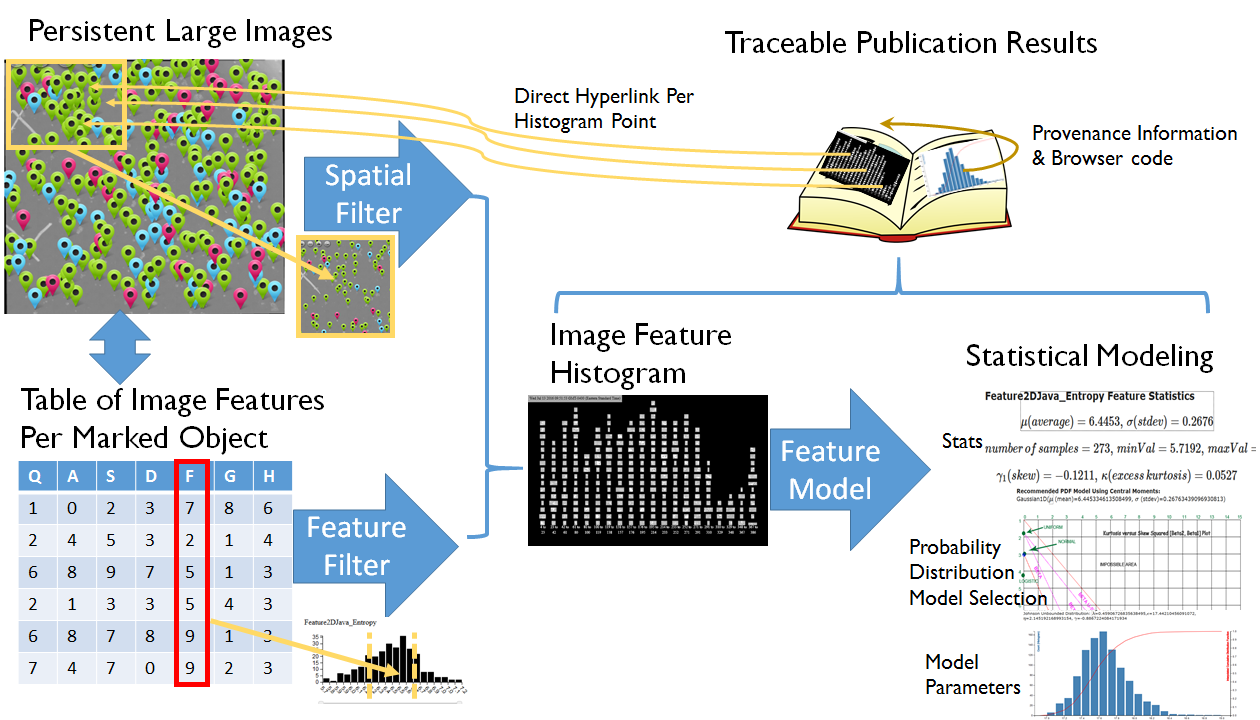
Overview of generating traceable publication results (histograms and statistical models) over very large images using the Web Statistical Modeling tools. It consists of two main steps such as filtering (spatial region and feature range filters) and statistical modeling.
The main goals of this web tool are
to provide access to very large image data and the derived features from those images for combined spatial and statistical analyses,
to enable interactive spatial region and feature range filtering to support sensitivity studies (sub-sampling) and removal of uncontrolled experimental artefacts,
to generate histograms with traceable contributing points in each bin to persistent image collections,
to facilitate visual understanding of a multitude of feature histograms representing a single object by using image thumbnail of objects,
to provide client/browser-based functionality to compute statistics, select a suitable model for a histogram to be represented by a probability distribution function (PDF), and estimate parameters of a selected PDF model from the family of Johnson's PDFs, and
to save provenance information about filtering, histogram creation, and statistical modeling in addition to preserving the hyperlinks between histogram data points and their locations in persistent large image collections.
Use Case: Discoveries from Stem Cell Microscopy Images
In this prototype demonstration, two co-registered images were selected from the stem cell experiment conducted at MML NIST using phase contrast (PC) and green fluorescent protein (GFP) microscopy imaging (replicate #1, frame 18, half a gigapixel per image, 16 BPP). Each image captures 273 stem cell colonies that have been automatically segmented. Each colony is described by 78 features that could potentially become indicators of stem cell health. To capture spatial heterogeneity of colonies, each colony is sub-divided into hexagons and each hexagon is characterized by 78 features as well. The application/data specific goal is to discover population-level statistical models and rare events, as well as to assess sensitivity of statistical models to spatial location.
The demonstration allows scientists to perform statistical analyses of all features in a browser (PC or GFP channel, at colony or hexagon spatial level) and to publish the results of statistical analyses such that they are traceable to the persistent image collection at https://isg.nist.gov/deepzoomweb/view/image/replica1 and to the JavasScript implementation used to compute the results.